Twister History


Get it from CNET Download.com! Other download options

You may also be interested in the tornadohistoryproject.com for more information about Tornado history.


Zom in View of Chicago Area Tornado history


View of Tornado severity in southern states

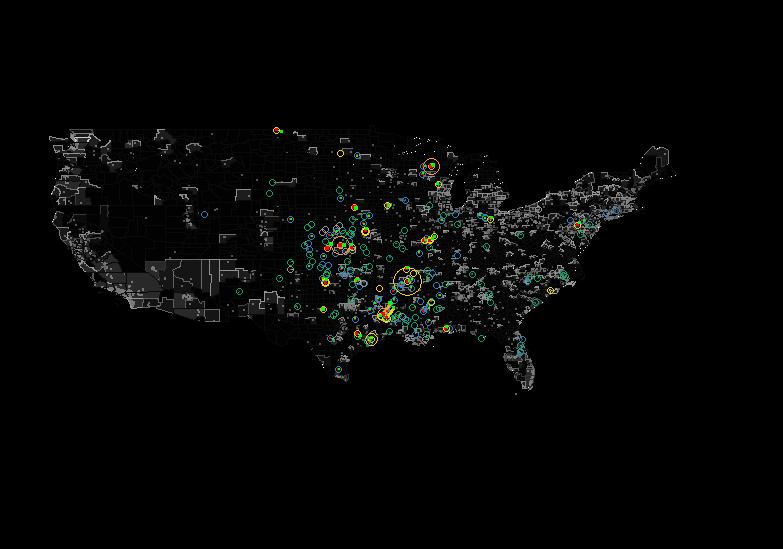
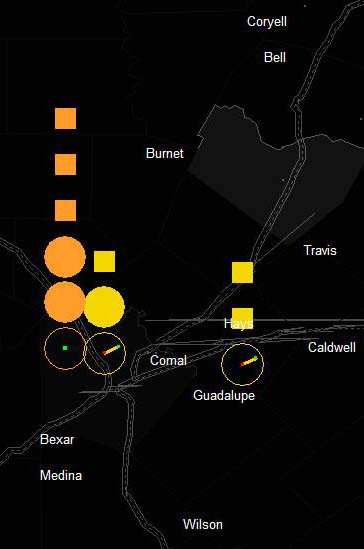
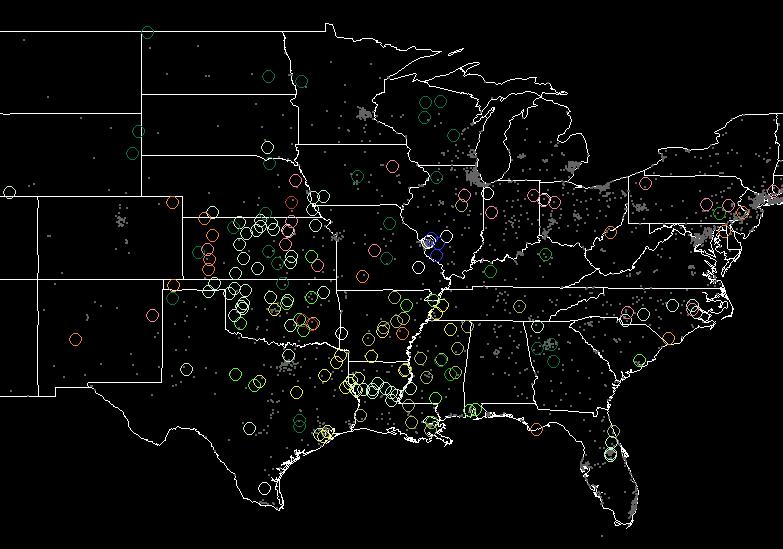
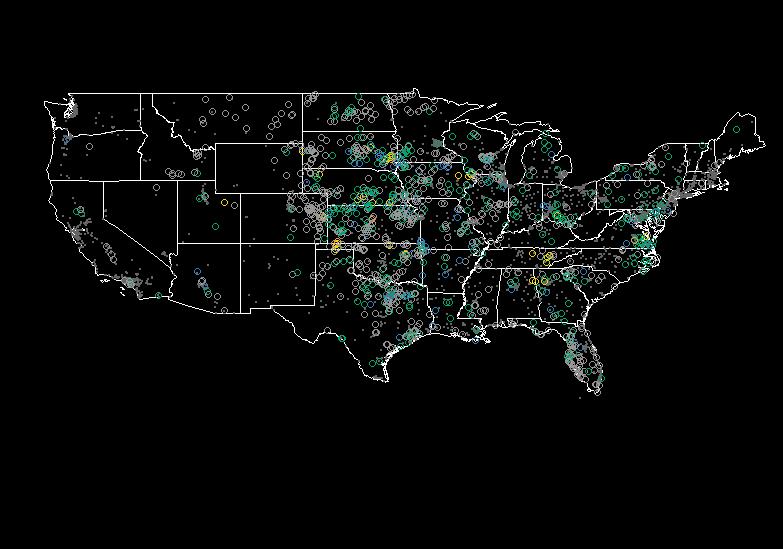
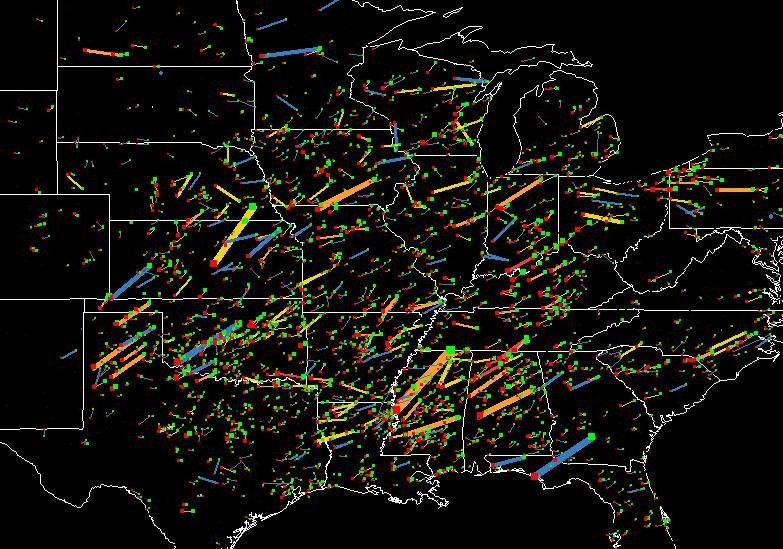
Overview

Visualization of Tornadoes

Twistery (Twister History) is a simple, free program to visualize the history of tornadoes in the United States. The program allows users to build their own maps of tornado activity in the continental United States.

The program provides the following data for all recorded tornadoes in the continental United States:

  • Location
  • Force Level (Fujita Scale)
  • Path
  • Width
  • Height
  • Area
  • Number of Injuries
  • Number of Deaths
  • Dollar Amount of Damage

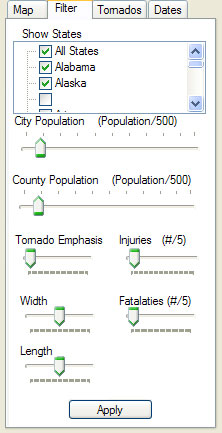
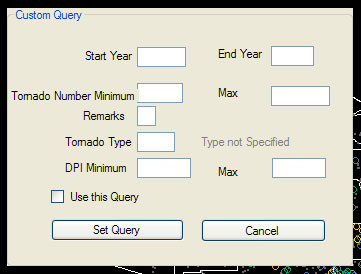
Users can filter the visualization by tornado attributes, date of occurrence or state. Users can also execute custom queries from the custom query pane. The custom queries allow users to specific the following:
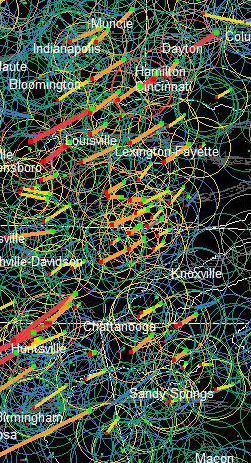
  • DPI
  • Tornado Type
  • Interstate Minimum
  • Remarks (hail, etc)


Visualization


Tornadoes are visualized using an intuitive, simple system of shapes:

  • A single open circle indicates a Tornado occurrence
  • Paths are indicated by a line with a green square at the tornado's origin, and a red square at it's end. Thickness of line indicates tornado size
  • Width, Height, and Area are alternatively described by the diameter or line thickness of each depicted tornado occurrence
  • Injuries are indicated by a stack of closed squares
  • Deaths are indicated by a stack of closed circles
  • Damage is indicated by the size of an open square
  • Tornado F-Level is indicated by the color of any shape

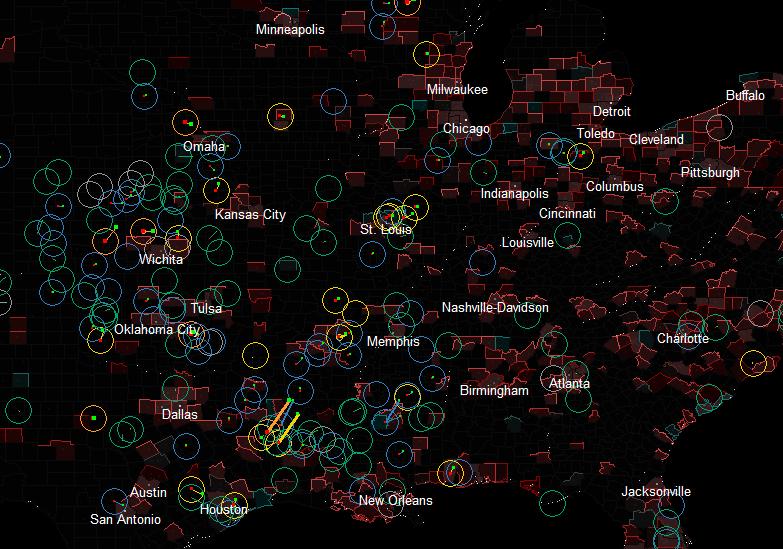
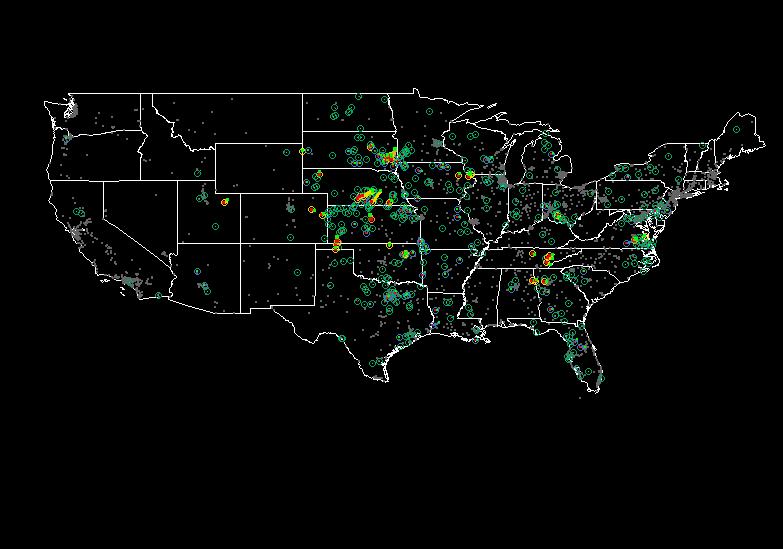
Users may visualize the data as static images or as animations. The visualizations may be customized by changing visualization calculation factors and colors of static and dynamic content. Static images may be exported to popular image file formats for comparative analysis.


To evaluate correlation and identify location the following information is dynamically displayed:

  • City and County level Population
  • City and Count Level names
  • Roads, Rivers and Lakes
  • Aggregates of tornado numbers, injuries, deaths, damage
  • Individual tornado instances can be investigated by selecting a single tornado instance, or by selecting the tornado from the drop down list on the tornado's panel.

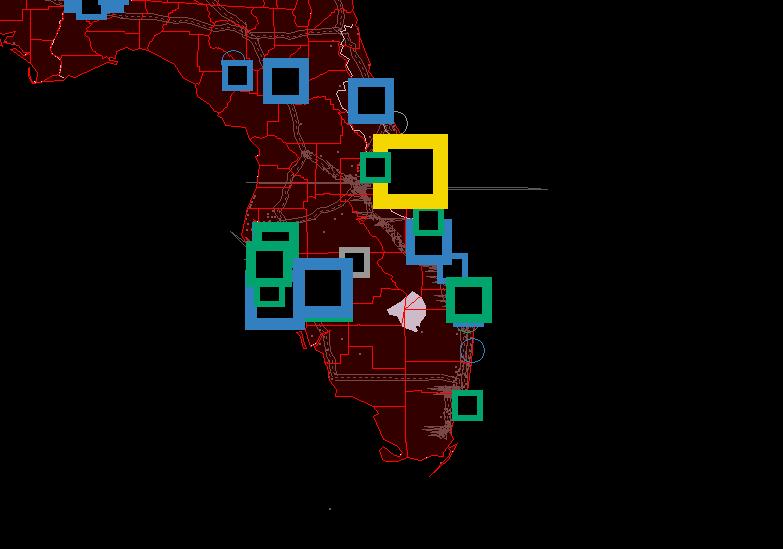
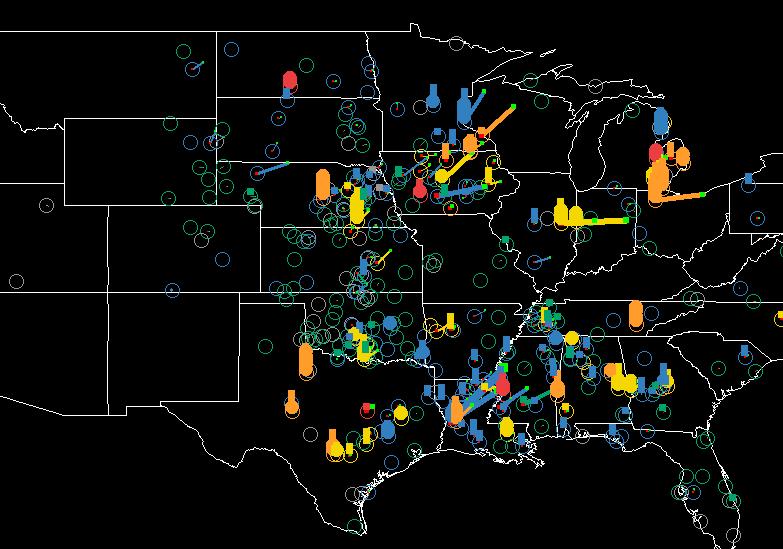
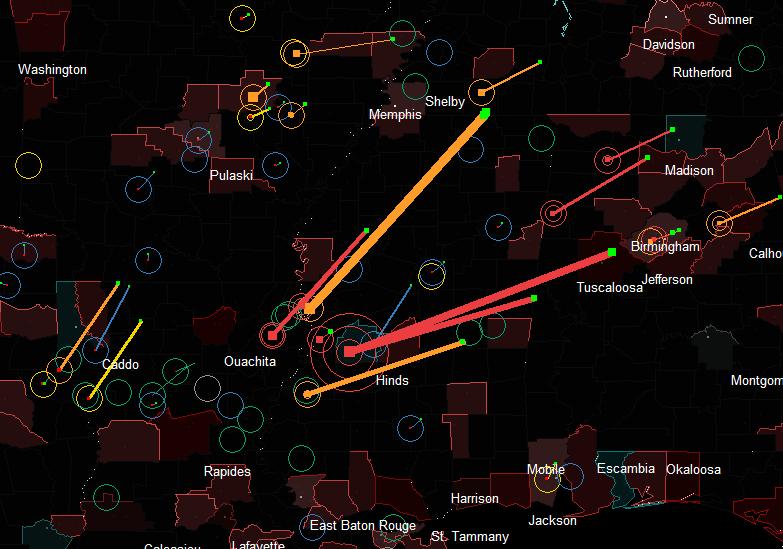
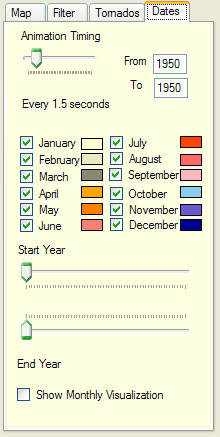
Data can also be presented by date, indicate month by each color:
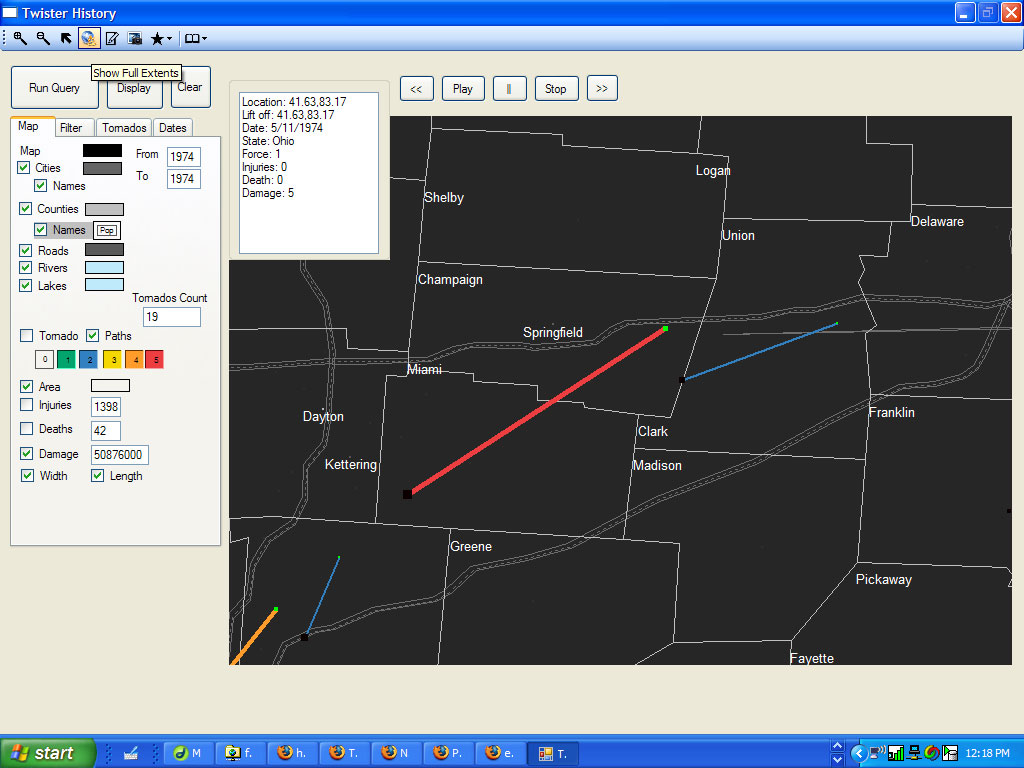
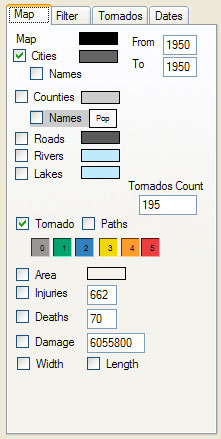
F-Scale of Tornadoes in the USA

Map of tornadoes in the U.S.A.


Tornados in Florida, U.S.A.

Control panel for Twistery Tornado History

Interface


The application's primary interface is designed to be an interactive legend. This legend contains reference information for each of the map elements:


The applications provides the following interface elements for map navigation:

  • Map Navigation:
  • Zoom, Pan and Select
  • Max Extents

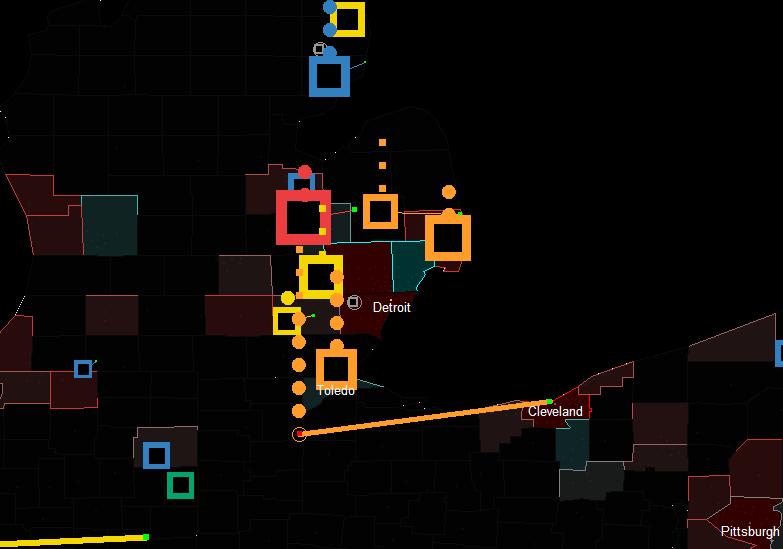
The following items can be modified by the user to enhance the emphasis of the visualization:

US Map: On, off, and color
Cities: On, off, ,color, names, minimum population to display
Roads: On,off,color
Rivers: On,off,color
Lakes: On,off,color

The following items can be modified by the user to enhance the visualization of tornadoes

  • Tornado Location: On or off
  • Paths: on or off
  • Force: on or off per range (0-5)
  • Injuries:on or off, multiple (number of glyphs an injury represents)
  • Deaths:on or off, multiple (number of glyphs a death represents)
  • Damage:on or off, multiple
  • Width:on or off
  • Length:on or off

The following items can be modified by the user to effect animation

  • Play, stop, pause, forward and rewind
  • Animation rate
  • Locate tornado while animating (virtual tour)


Implementation


This program was written in Visual Basic .Net. It is based on the Map Window OCX. The code uses classes to store map preferences, user query preferences, and tornado instances. Geo-referenced data, such as county populations, are “normalized” by dividing the population by a user specified factor and distributing the value on the user selected color. Other visualization elements are represented through simple calculations of size or color.

Data is stored in an Access database and .Net datasets for fast execution. Data can be exported to shape files. Data can be imported from raw, comma delimited text files using the program's data import tool. Data is stored in a single access table, that maintains the data type and structure of the NOAA tornado archive. Standard , dynamically written SQL statements handle the insertion and selection of records.

Data is converted through a set of enumerations and lookup functions for human readability.

The use of a database allows the program to include user specified queries and the the "top queries" provided in the user interface.

Screenshot of Tornado History program by Lindsay Grace  
 

Use: How to use the Tornado History Tool

  • To Visualize several tornadoes
    1. Select the tornado dates using the dates tab or specify years in the text boxes
    2. Filter the data by selecting the F-Force to ignore, the data to be visualized (e.g. Injuries or damage), and the intensity of visualization factors
    3. Select display to update the display
    4. Take a picture of the map
    5. Maps are not cleared when retrieving new data so that users can review a comparison between visualizations.


  • To Locate a Specific Tornado
    1. Visual a set of tornadoes
    2. Select the region surrounding the tornado occurrence or select the volcano from the tornado's tab (the tornado will be placed in the middle of the screen)

      The color of items may be changed to enhance visualization. Please choose the color bar next to the legend item to change it's color.

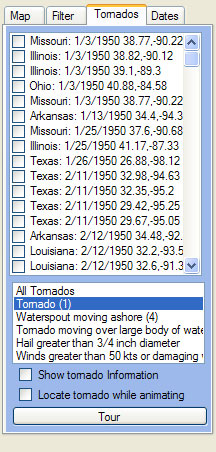
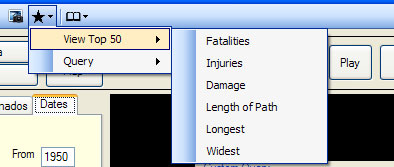
Query Filters and Map Filters

There are two modes to filter and refine the visualization. Query filters, which effects the source data used for the visualization, and Map filters, that effect the display properties of the map. When changing map filters the user need only redisplay the map. When changing the query filters, the user must retrieve the new data.

Top Queries

Users can specify select from a set of predefined queries for the top injuries, deaths, damage, et al.

Custom Queries:

Uses can customize their queries by selecting the custom query from the queries drop down list.


  All tornadoes in Tennesse


Observations


1993 1993
1993 Map of Tornados in Continental United States of America 1993 Map of Tornados in Continental United States of America - Paths
A view of the tornados that occurred in 1993 throughout the continental united states (origins only) A view of the tornados that occurred in 1993 throughout the continental united states (tornado paths only)
1953  
1953 view of descruction caused by tornado events. Midwest area tornado map 1953
1953 view of descruction caused by tornado events. Midwest area tornado map indicating number of people wounded or killed by tornado.
Long Tornadoes  
A map of some of the tornados with some of the longest paths from 1955-1995. A map of some of the tornados with some of the longest paths from 1955-1995.
A map of some of the tornados with some of the longest paths from 1955-1995.  

Alternative download locations

Click here to download Twistery Tornado History directly from the alternate mirror

Download Installer Here (24 mb)
Installation note: please install in the default director, c:\tornado to prevent problems. Thanks!